| Formulas | Index |
The following formulas and the accompanying comments were taken from the help file for SEER*Stat (a cancer statistics program produced by the Surveillance Research Program of the Division of Cancer Control and Population Sciences, National Cancer Institute, and Information Management Services, Inc.).
A crude rate is the number of cases per 100,000 in a given population.
![]()
An age-adjusted rate is a weighted average of crude rates, where the crude rates are calcualted for different age groups and the weights are the proprtions of persons in the corresponding age groups of a standard population...The age-adjusted rate for an age group comprised of the ages x through y is calculated using the following formula:
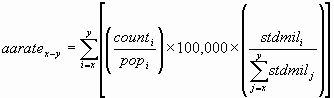
where counti is the number of cases for the ith age group, popi is the relevant population for the same age group, and stdmili is the standard population for the same age group.
This calculation assumes that the cancer counts have Poisson distributions.
![]()
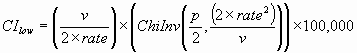
This calculation assumes that the cancer counts have Poisson distributions. Suppose the age-adjusted rate is comprised of age groups x through y.

The endpoints of a (1 - p) × 100% [1] confidence interval are calculated as:


Where ChiInv(p,n) is the inverse of the chi-squared distribution function evaluated at p and with n degrees of freedom, and we define ChiInv(p,0) = 0.
Although the normal approximation may be used with the standard errors to obtain confidence intervals when the count is large, we use the above exact method that holds even with small counts (see Johnson and Kotz, 1969, or Fay Feuer, 1997). When the count is large the 2 methods produce similar results.
Suppose that the age-adjusted rate is comprised of age groups x through y, and let:
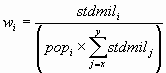
![]()
![]()
The endpoints of a (1 - p) × 100% [1] confidence interval are calculated as:
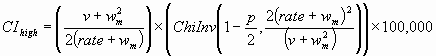
where ChiInv(p,n) is the inverse of the chi-squared distribution function evaluated at p and with n degrees of freedom, and we define ChiInv(p,0) = 0.
This method for calculating the confidence interval was developed in Fay and Feuer (1997). The method produces similar confidence limits to the standard normal approximation when the counts are large and the population being studied is similar to the standard population. In other cases, the above method is more likely to ensure proper coverage.
Note: The rate used in the above formulas for the confidence interval endpoints is not per 100,000 population.
[1] For example, to compute a 95% confidence interval, use p = 0.05.